Sungrow iSolarCloud is a comprehensive real-time solar monitoring system designed to provide homeowners with complete visibility into their energy production and consumption. This review delves into the key features and benefits of the iSolarCloud platform, examining its ability to offer clear, concise data presentation and insightful analysis. We explore its functionality from real-time power generation monitoring to detailed historical data analysis, highlighting its effectiveness in optimizing energy usage and proactively identifying potential system issues. The review assesses the user-friendliness of the interface and the value it brings to users seeking to maximize their return on solar investment.This in-depth analysis covers various aspects of the iSolarCloud platform, including its real-time data display, daily and hourly energy summaries, granular component monitoring capabilities, and overall system health assessment. We will evaluate the effectiveness of the platform in providing actionable insights for improved energy management and troubleshooting, comparing its features and user experience to other systems on the market. Ultimately, this review aims to provide a clear understanding of the strengths and weaknesses of Sungrow iSolarCloud, assisting readers in determining its suitability for their solar energy monitoring needs.
Pros And Cons
- Provides a complete overview of daily solar energy production and consumption.
- Shows energy production and consumption data in kW and kWh.
- Offers graphical representation of energy usage throughout the day.
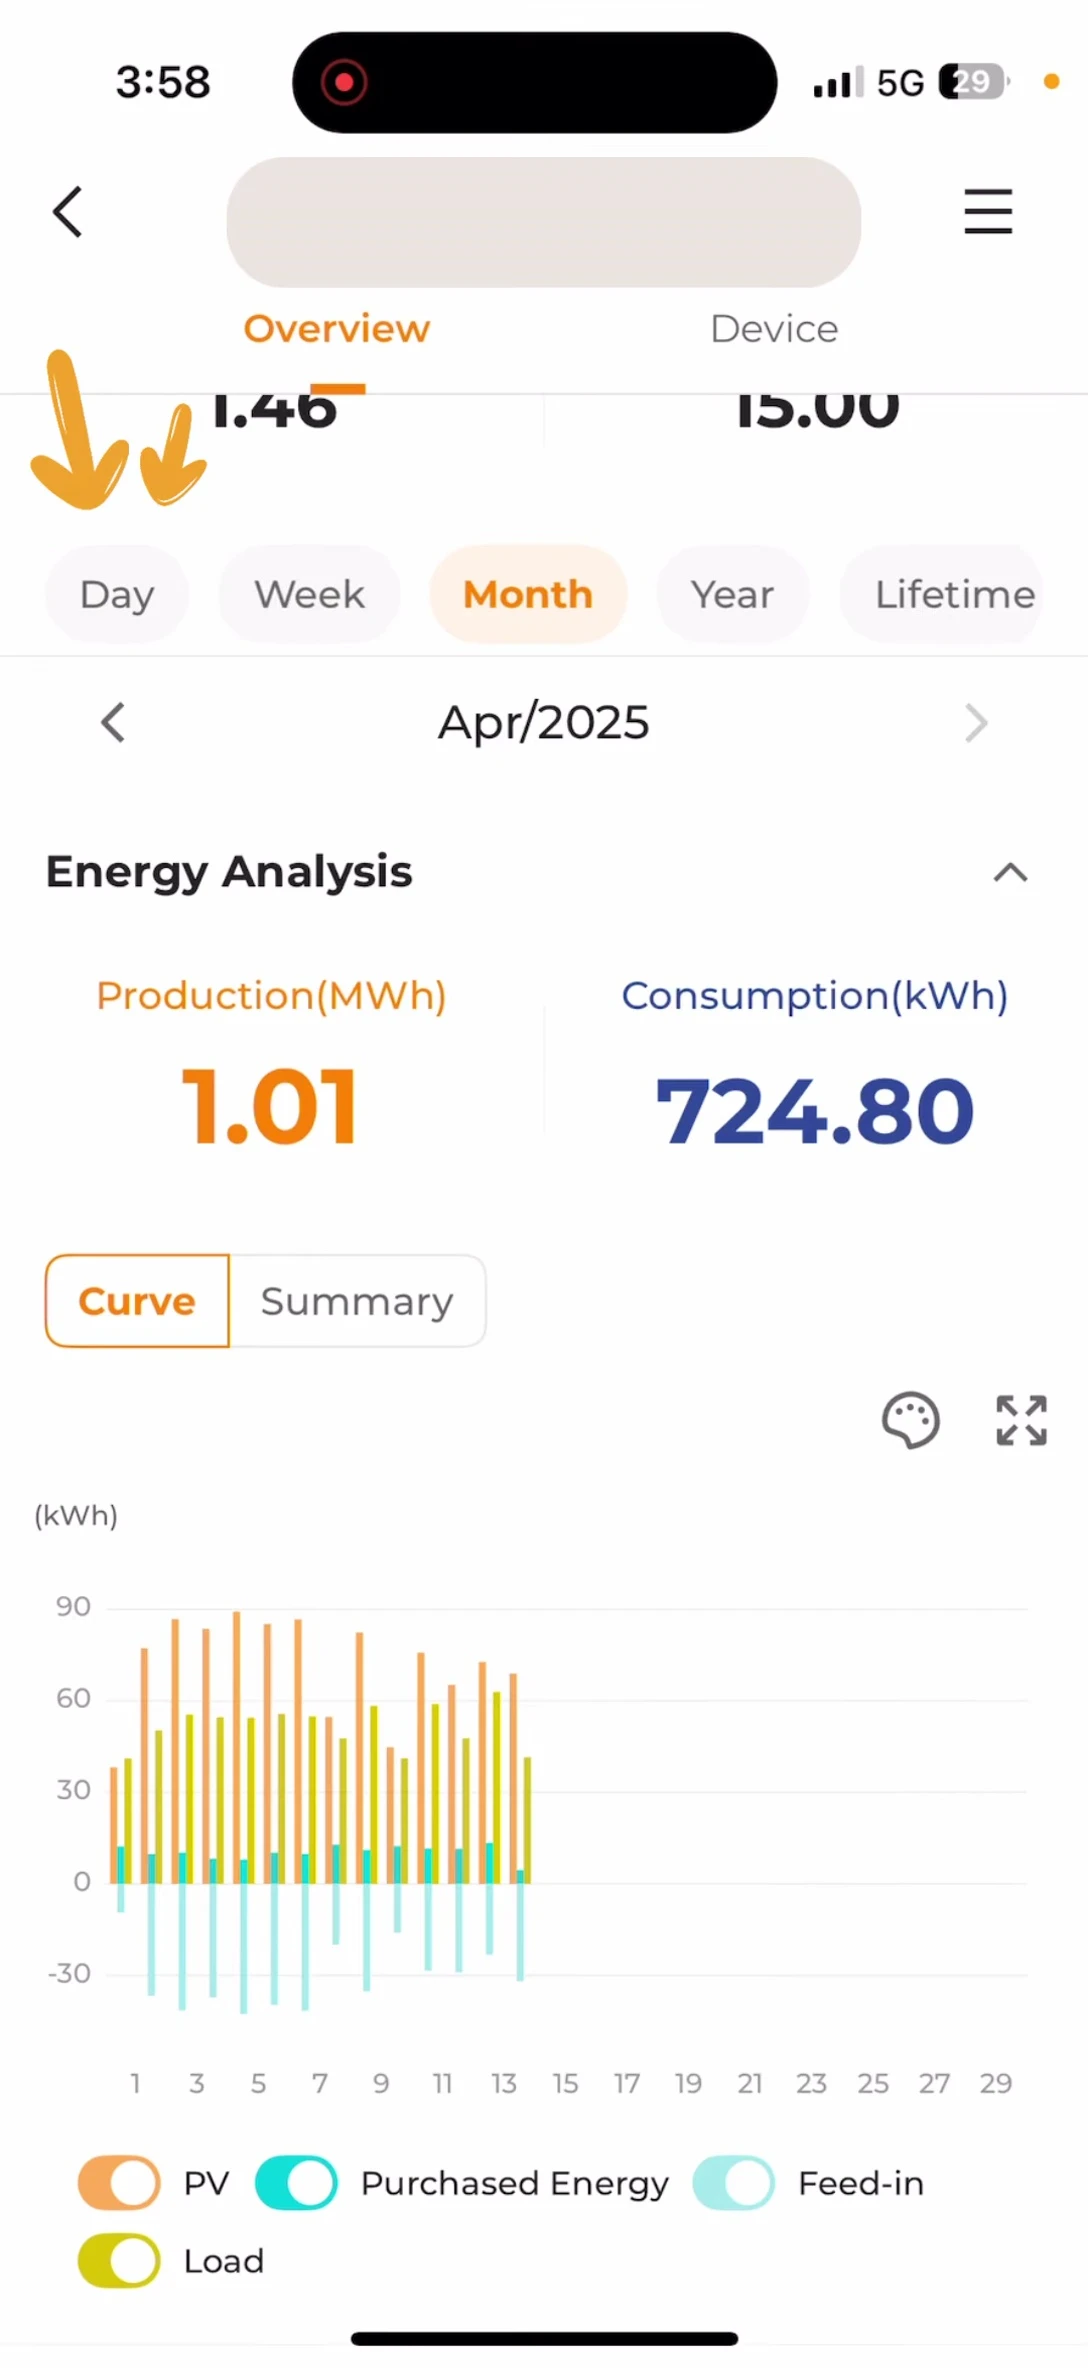
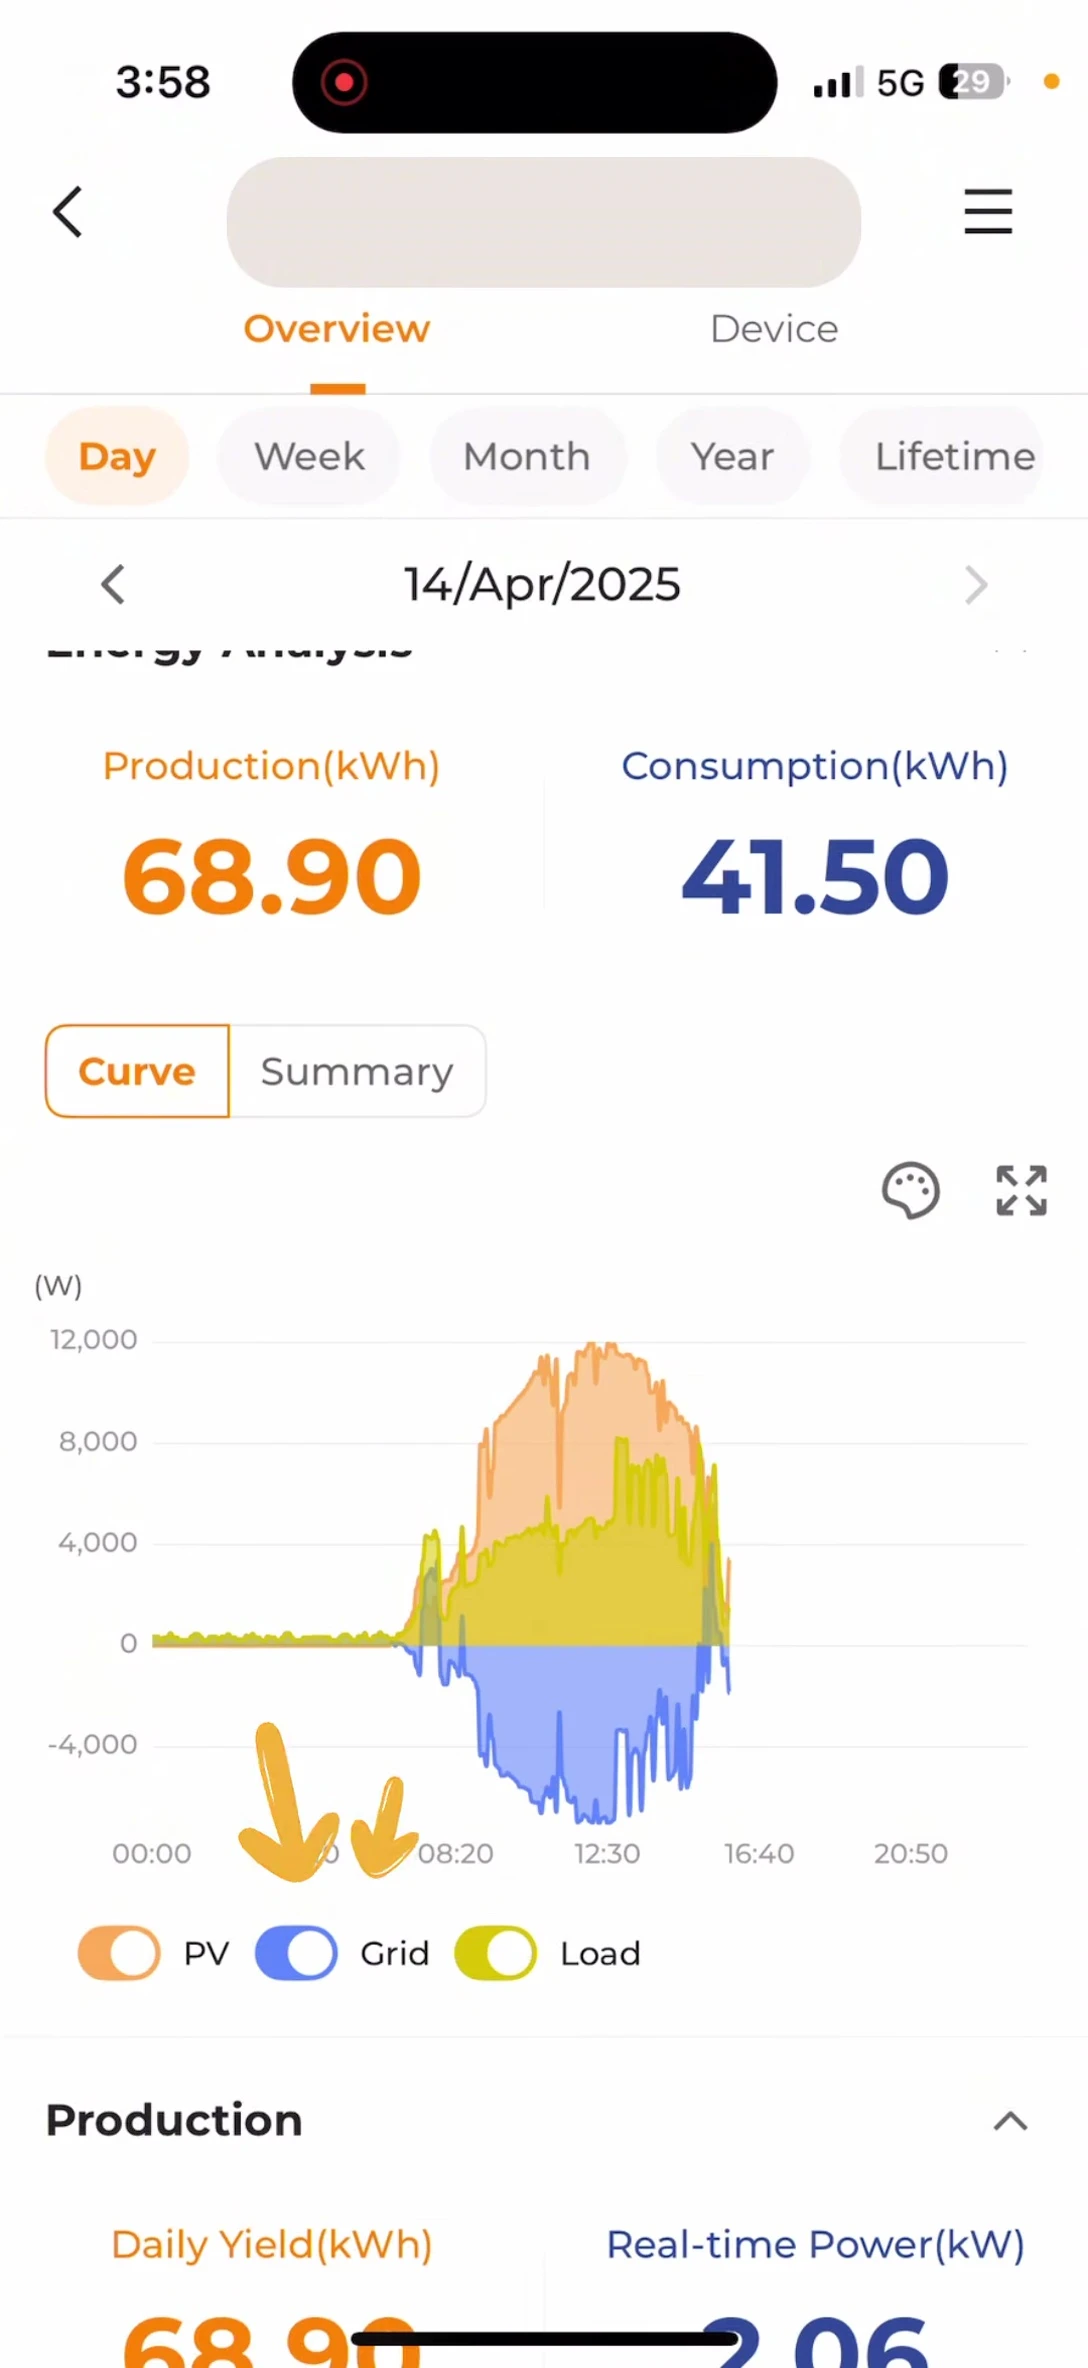
- Allows viewing data for different time periods (day, week, month, year, custom).
- Displays the status of inverter, meter, and communication module.
Read more: AMI Meter Reading Guide: Understanding Your Smart Electricity Meter
Real-time Energy Production Overview
The Sungrow iSolarCloud dashboard provides a clear, real-time overview of your solar energy production. At a glance, you can see the current power generation from your solar panels, the amount being fed back to the grid, and the amount being consumed by your home. This allows for immediate understanding of your system's performance.
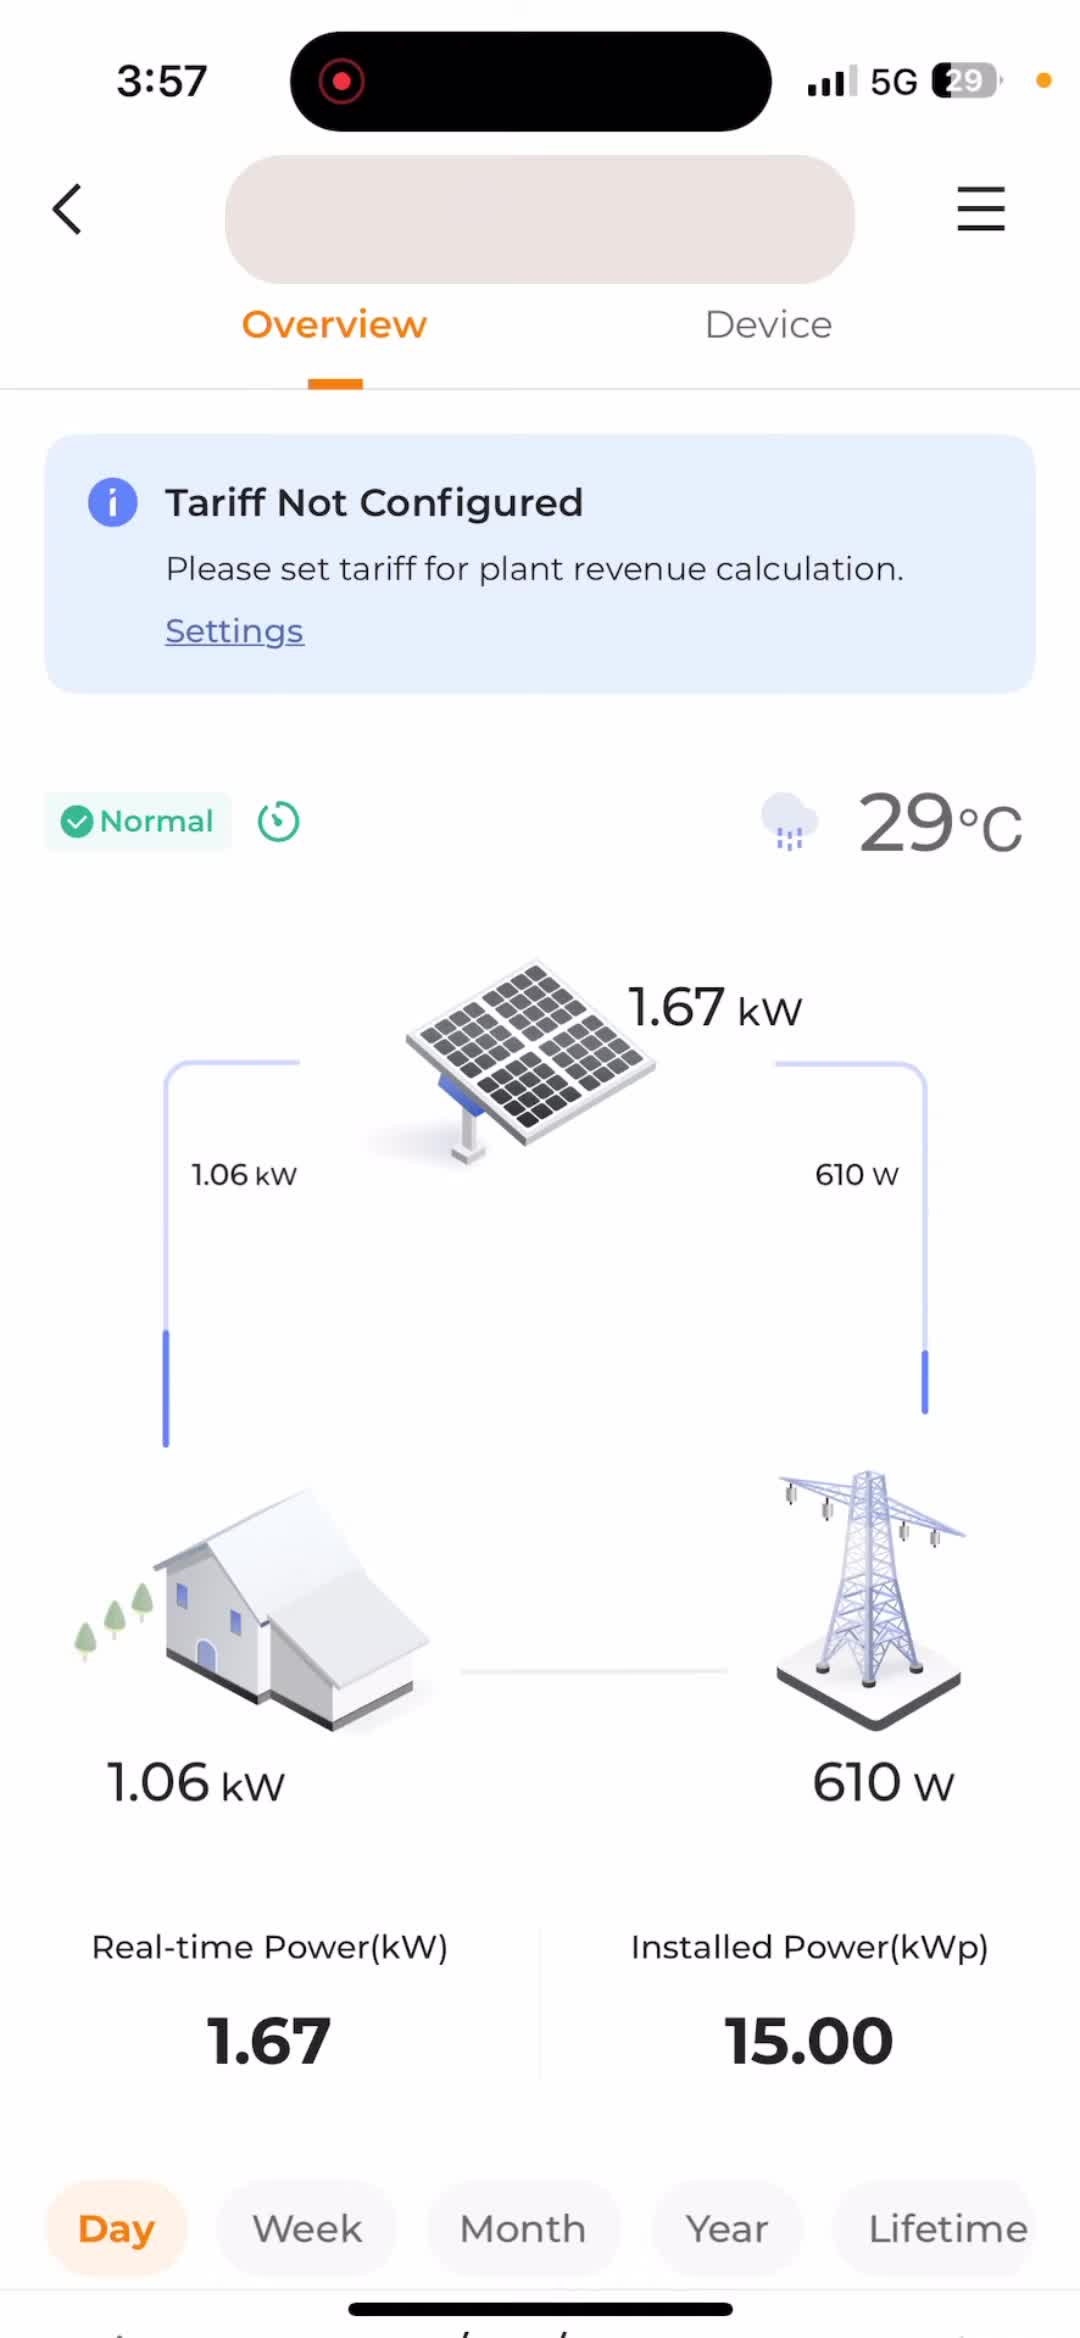
The system displays key metrics like total kW production, grid export in watts, and home consumption in kW. This data provides a snapshot of your current energy usage and generation, enabling informed decisions about energy consumption.
Daily Energy Summary and Historical Data
Beyond real-time data, iSolarCloud provides comprehensive daily summaries of energy production and consumption. It shows the total kilowatt-hours (kWh) generated and consumed throughout the day, giving you a clear picture of your energy usage patterns. This allows for better energy management and identification of potential savings opportunities.
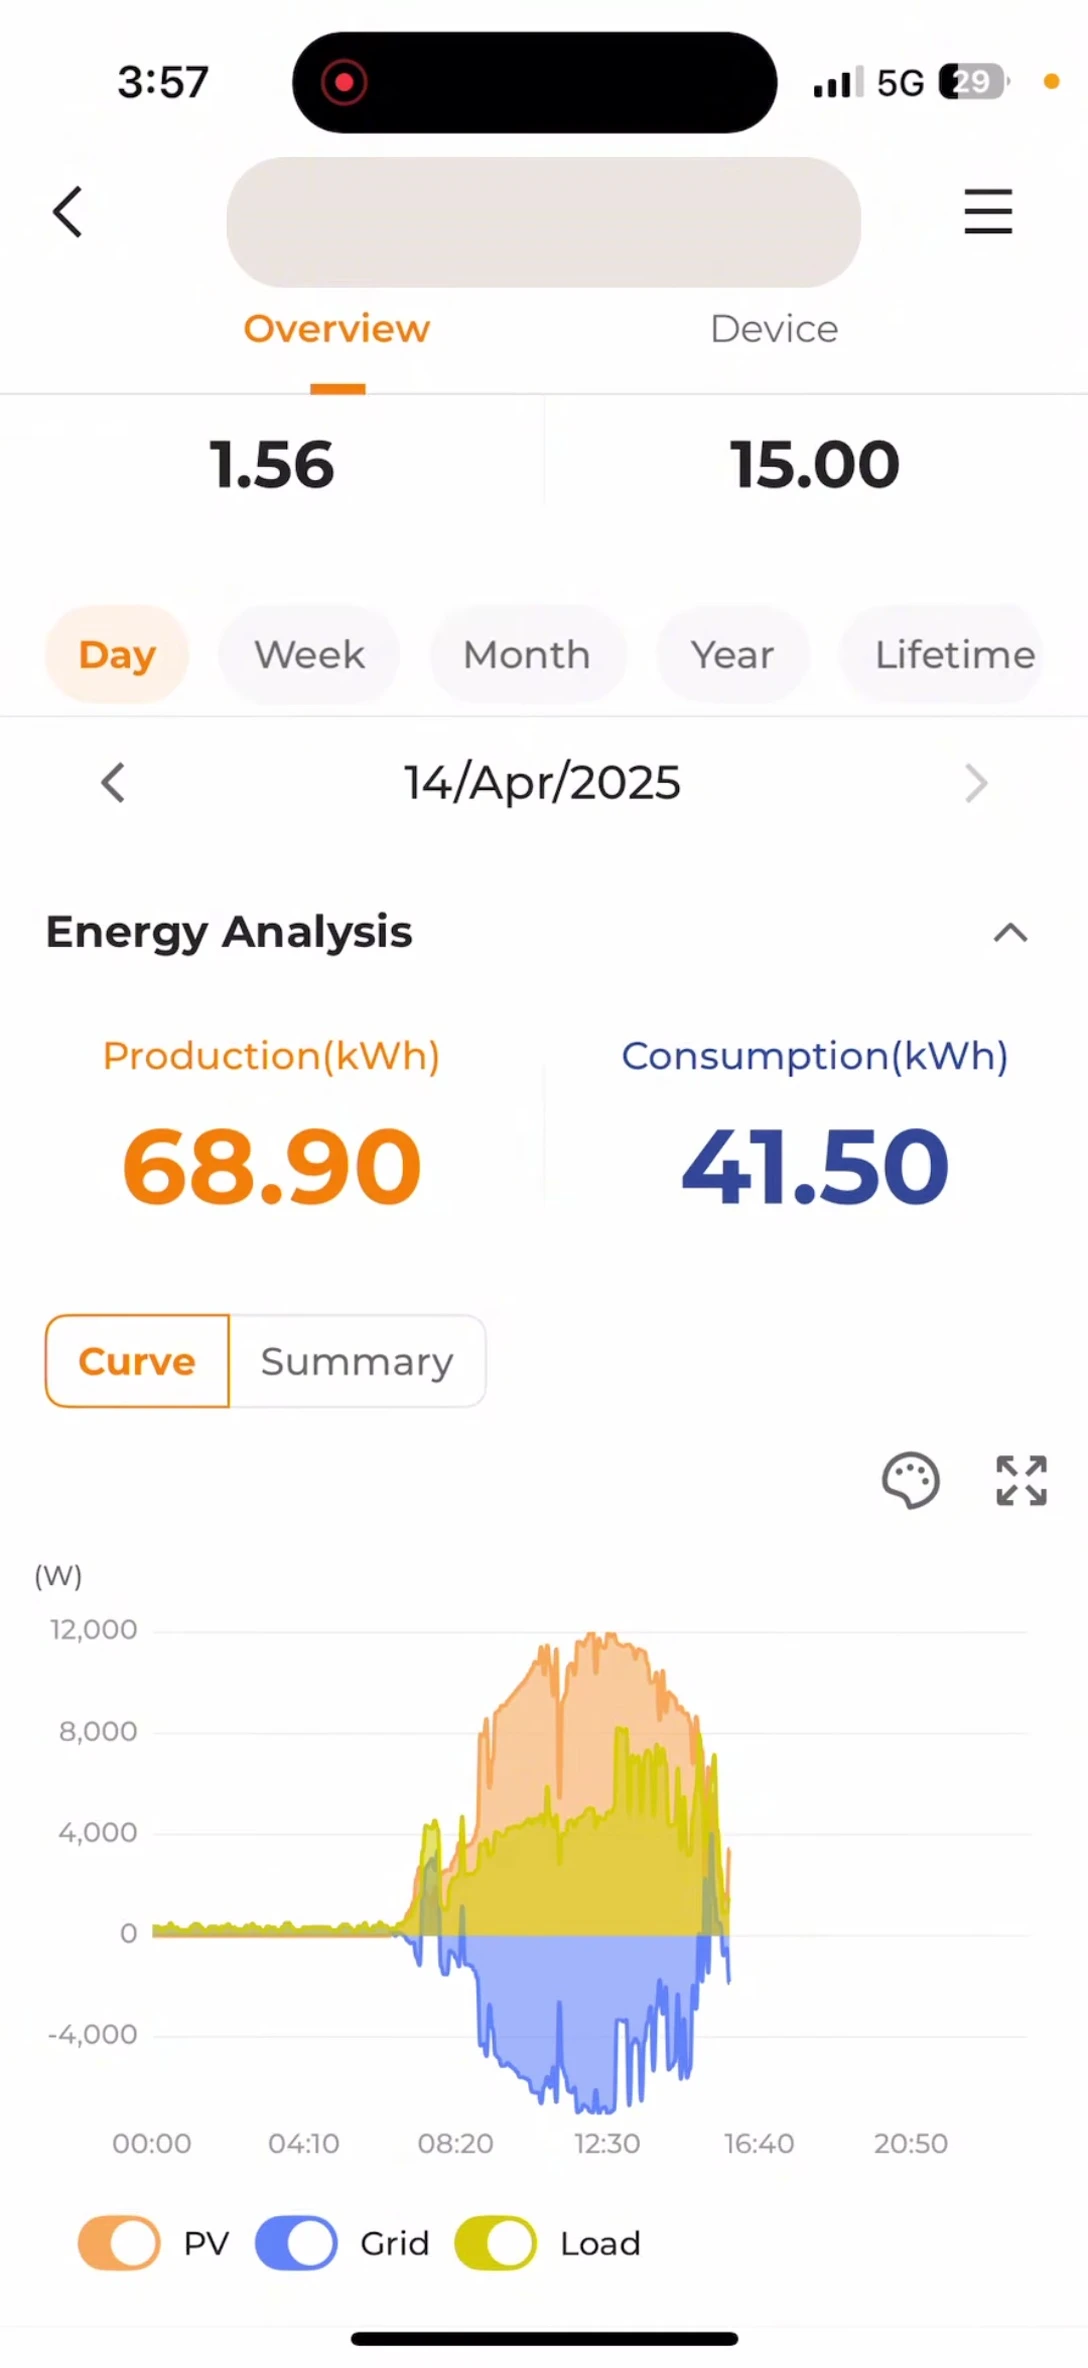
The platform's intuitive interface allows easy access to historical data, showing energy production and consumption trends over various timeframes, including daily, weekly, monthly, and yearly views. This historical data is invaluable for understanding long-term system performance and identifying any anomalies or potential maintenance needs.
Detailed Hourly Energy Breakdown
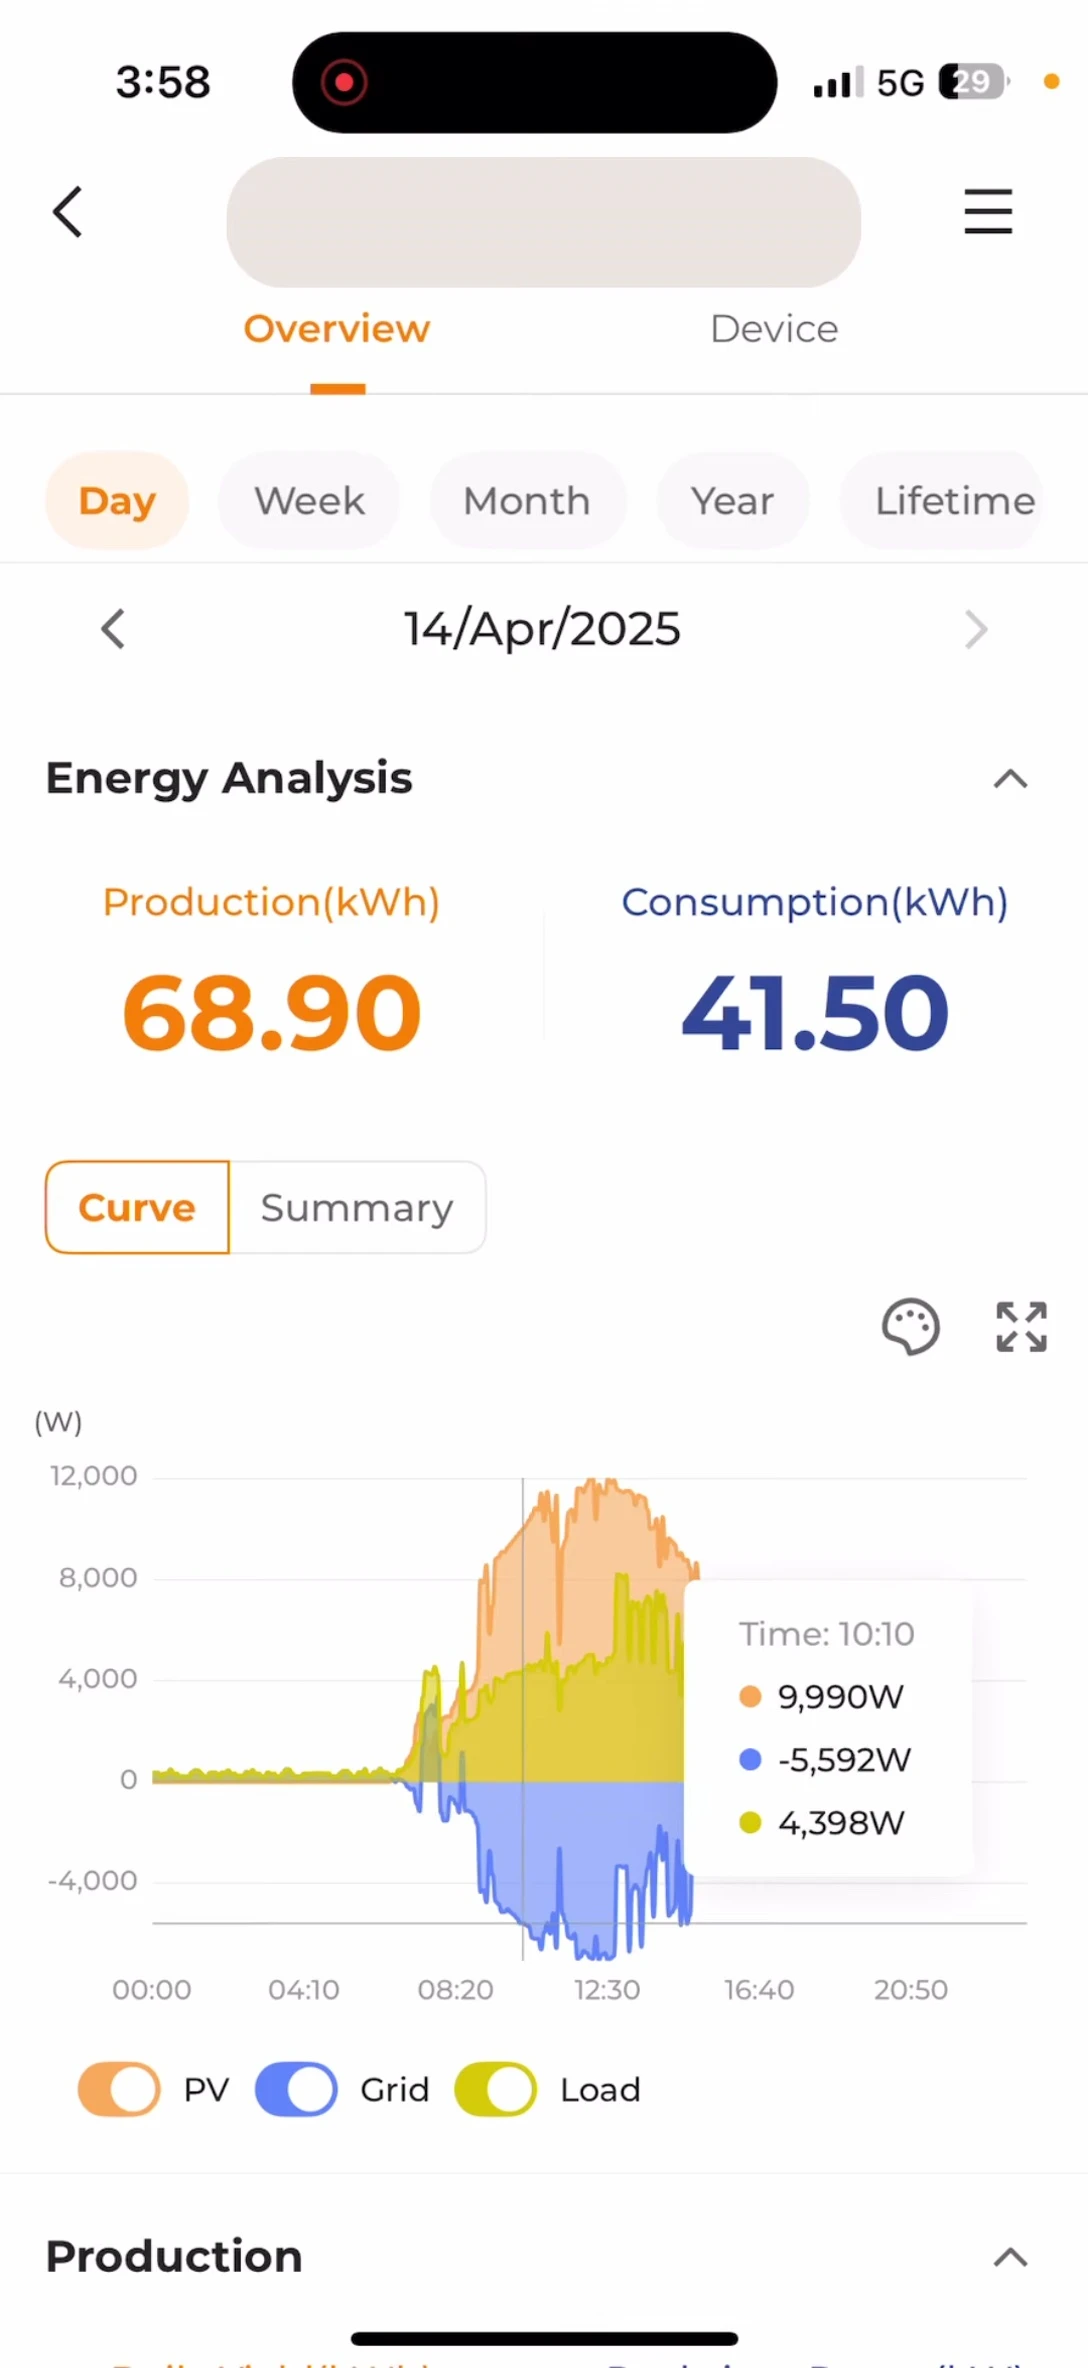
The system allows you to delve into detailed hourly energy data. By scrolling through the interactive graph, you can see the precise energy production, consumption, and grid export for each hour of the day. This detailed analysis helps to understand energy peaks and valleys and optimize energy usage further.

This granular view allows for a thorough understanding of how your system performs throughout the day, identifying potential areas for improvement in energy efficiency. For example, you might discover periods of high consumption that can be adjusted.
Individual Component Monitoring
The Sungrow iSolarCloud allows for monitoring individual components of your solar system. You can view data specifically related to your PV production, grid export, and home energy load. This level of detail makes troubleshooting and identifying any potential problems easier.
By isolating each component's performance, you can quickly pinpoint the source of any issues. For instance, if your home consumption is unexpectedly high, you can quickly identify the problem without having to manually check each component.
System Status and Health
The platform provides a clear indication of the overall health and status of your solar system. It displays the status of key components like the inverter and communication module, ensuring you're always aware of any potential issues. Early detection of problems can prevent more significant issues down the line.

The simple indicators for each component (normal/abnormal) allow for quick assessment of the system's overall health and prompt attention to any potential problems. This proactive approach safeguards your investment and ensures optimal performance.
Conclusion: Is Sungrow iSolarCloud Worth It?
Sungrow iSolarCloud offers a comprehensive and user-friendly platform for monitoring your solar energy system. Its real-time data, detailed historical analysis, and individual component monitoring provide valuable insights into your energy usage and system performance. The intuitive interface makes it easy to navigate and understand the data, even for those without a technical background.
The system's ability to proactively identify potential issues, combined with its detailed reporting capabilities, makes it a valuable asset for homeowners looking to maximize their solar energy investment and improve their energy management. While other monitoring systems exist, iSolarCloud's features and ease of use make it a strong contender.