Are your electricity bills unexpectedly high? Homeowner Rob faced a similar dilemma, witnessing a dramatic increase in his winter energy costs. Initially suspecting a faulty meter or rate hike, a deeper investigation revealed a more complex energy consumption scenario within his renovated 1875 home. This case study explores the troubleshooting process, highlighting the challenges of diagnosing energy usage in a multi-unit dwelling with a mix of old and new appliances. From initial visual inspections of the electrical panel and analog meters to the implementation of advanced smart energy monitoring technology, we'll detail the journey toward identifying the primary energy culprits and developing effective, data-driven solutions.This article documents a practical approach to understanding and reducing household electricity consumption. We'll follow Rob's experience, revealing how a combination of traditional diagnostic techniques and cutting-edge energy monitoring tools helped pinpoint the significant energy drains within his home. The findings highlight the importance of data-driven insights in making informed decisions about energy efficiency and sustainability, ultimately leading to substantial cost savings and a more environmentally conscious approach to home energy management.
Pros And Cons
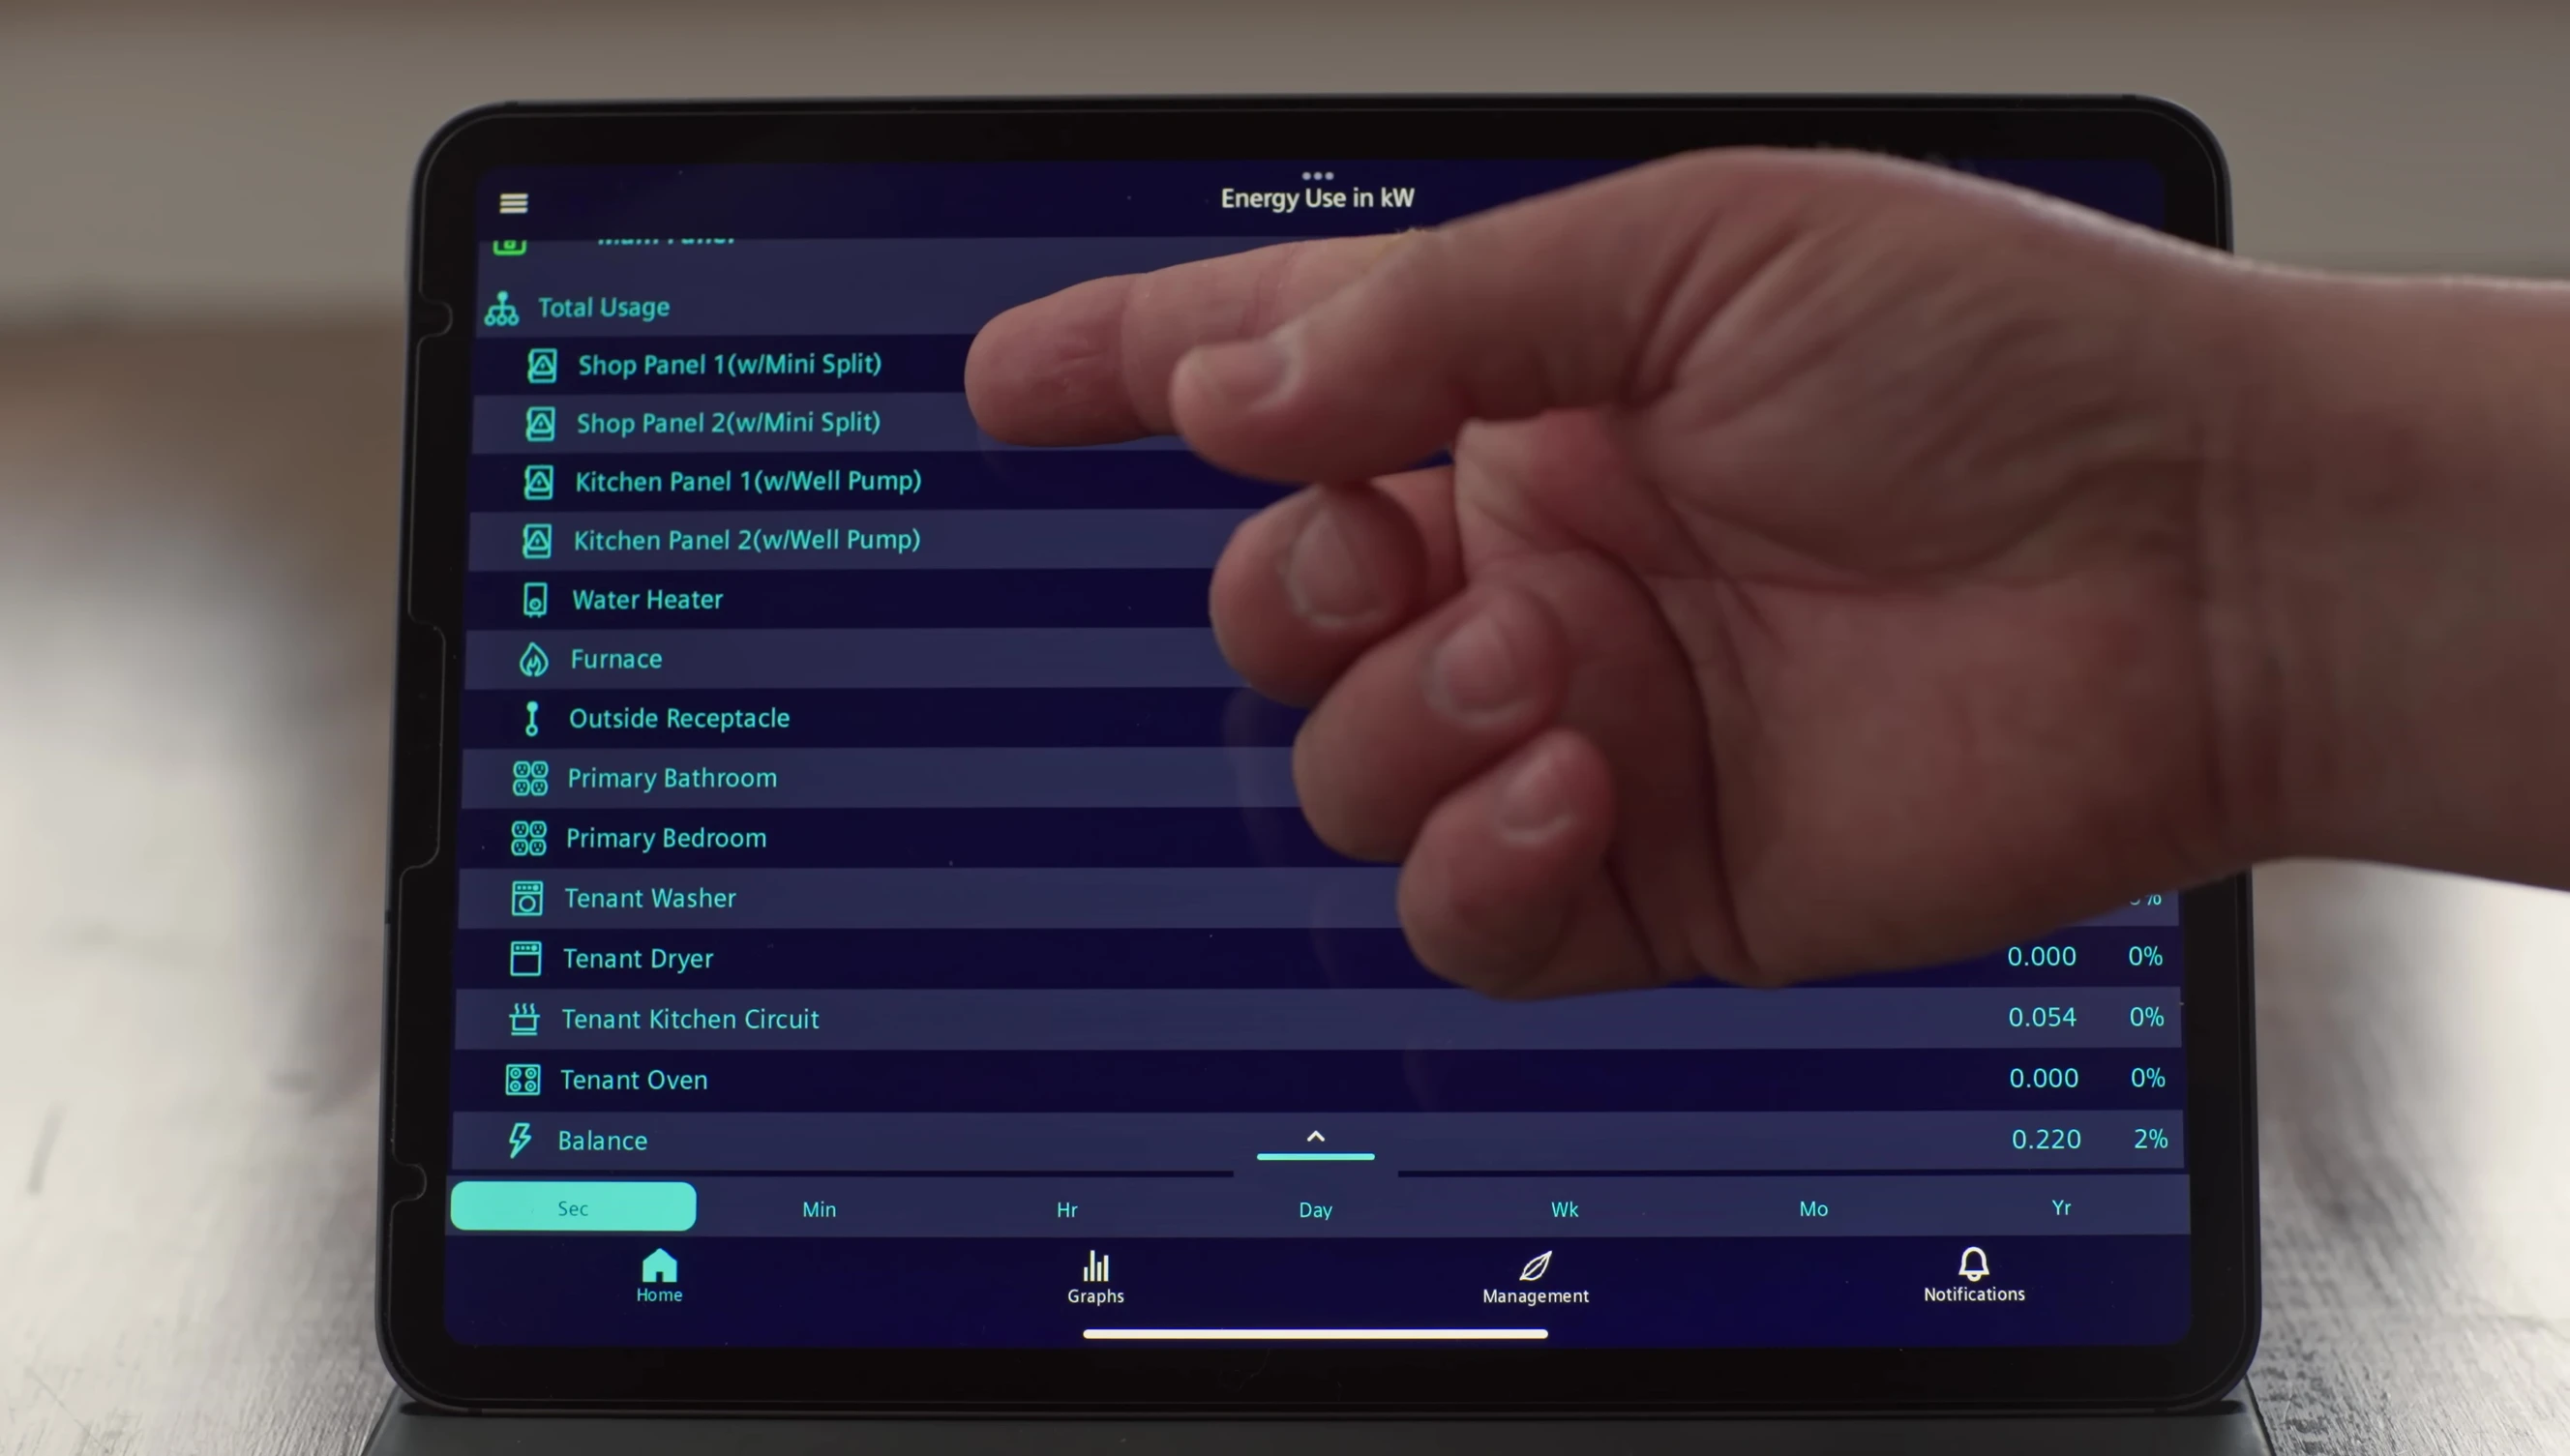
- Provides real-time data on energy usage.
- Shows detailed breakdown of energy consumption by circuit.
- Allows for historical data review (weekly, monthly, yearly).
- Helps identify high-energy consuming appliances.
Read more: AMI Meter Reading Guide: Understanding Your Smart Electricity Meter
Identifying the Problem: High Winter Bills
This homeowner, Rob, noticed a significant spike in his winter electricity bills, nearly double the summer amount. Initial suspicions pointed towards a faulty meter or rate increase. However, a closer look revealed a more complex issue.
Rob's home, a renovated 1875 house, featured a mix of older systems and recent upgrades, including a mini-split for heating and cooling, new appliances, and electric cooking and laundry equipment. These additions significantly increased the home's electricity consumption.
The presence of two tenants, each with separate meters, further complicated the diagnostic process, requiring a careful examination of multiple electricity sources and usage patterns. Determining how each appliance contributed to the overall electricity demand was crucial.
Investigating the Electrical Panel and Sub-Panels
The inspection of the electrical panel revealed an older, but functional system. The presence of multiple sub-panels—one for the kitchen and another for the garage—indicated a distributed load across the house.

This complicated the diagnosis, as the high electricity consumption could be attributed to multiple appliances across several circuits, making it harder to pinpoint the exact culprits.

The expert highlighted the numerous electricity-consuming appliances such as multiple ovens, dryers, a water heater, and a well pump, all contributing to the overall high electricity usage.
Real-Time Energy Monitoring with Analog Meters
The use of analog meters provided a real-time visualization of electricity consumption. This allowed for immediate feedback on the impact of turning specific appliances on or off.
By observing the meter's speed, the technician could directly correlate the house's energy consumption with specific appliance use, making it simple to identify energy-intensive devices and usage patterns.
The visual feedback from the analog meters and the ability to turn off circuits allowed for immediate observation of changes in energy usage, streamlining the diagnostic process.
Installing and Using the Energy Monitor
To gain a more granular understanding of energy consumption, a smart energy monitor was installed. This involved connecting current transformers to the main breakers and individual circuits.

The installation process included securing the main unit, connecting current transformers to the main feed wires, and using smaller sensors on selected circuits to track detailed energy usage.

The monitor provided access to real-time and historical data, allowing Rob to track appliance-specific usage and understand how energy consumption varies over time.

Analyzing the Data and Identifying Culprits
Two months after installation, the data revealed the top three energy consumers: the mini-split heat pump, the well pump, and the electric water heater. This provided a clear picture of where energy was being consumed.

The heat pump's energy consumption increased significantly during colder weather, explaining the winter bill spikes. The well pump served three units, representing a substantial ongoing cost. The electric water heater also emerged as a major energy consumer.
This detailed breakdown allowed for targeted solutions. Replacing the electric water heater with a heat pump model and possibly exploring solar power were suggested to reduce energy costs substantially. The high usage of the heat pump and well pump are also high energy consumers that require careful management.
Conclusion: Solutions and Future Considerations
The energy monitor effectively pinpointed the primary causes of Rob's high electricity bills. The data-driven approach provided a clear understanding of energy usage patterns, facilitating informed decision-making.
Solutions proposed include replacing the electric water heater with a heat pump version to significantly reduce energy consumption. Installing solar panels was also suggested as a long-term solution to further offset electricity costs.
The successful use of energy monitoring provided valuable insights into Rob’s electricity consumption. This case illustrates the effectiveness of data-driven energy management for reducing household bills and creating more sustainable home environments.